

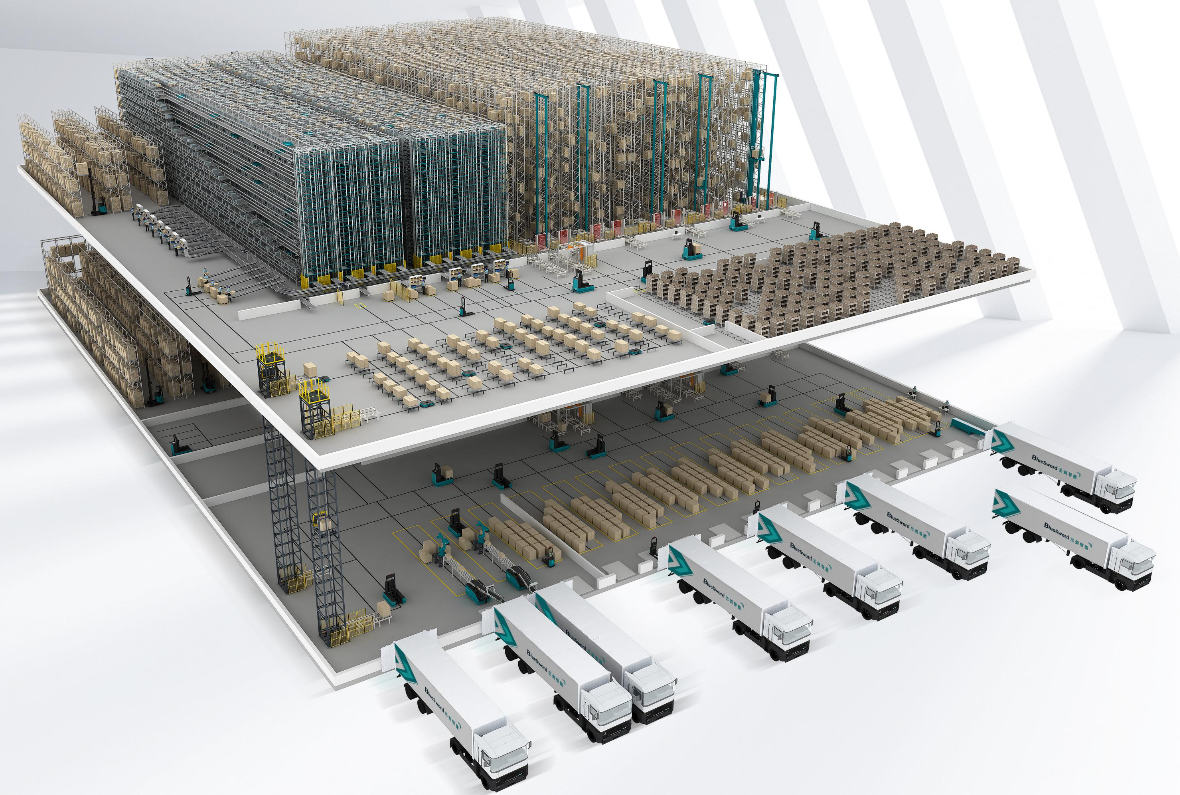
Framework overview and business case
This framework defines a repeatable sequence for deploying conveyor systems that meet throughput targets and safety requirements for FMCG operations. The goal is to align operational KPIs with capital expenditure and risk controls, which is why the design phase must reference existing examples of FMCG warehouse automation to validate assumptions about sortation rates, palletization constraints and labour models. The approach below prioritizes measurable outcomes: cycle time, mean time between failures, and incident frequency—each tied to contractual SLAs and cost forecasts.
Core components and technical scope
Break the system into three investible modules: mechanical conveyance (rollers, belts, transfer points), controls and software (PLC, motor controllers, ERP integration), and safety architecture (guards, emergency stops, light curtains). Specification must quantify throughput per hour, conveyor belt tension tolerances, and control latency limits. Procurement documents should require vendor test evidence for continuous duty cycles and provide warranty terms tied to defined MTBF metrics.
Phased deployment: design, pilot, scale
Stage 1 — Design: map SKU velocity, pick profiles and required sortation matrix; size conveyors to avoid choke points. Stage 2 — Pilot: validate a single line under full-load conditions and record real throughput and error rates. Stage 3 — Scale: cascade validated lines and introduce redundancy in critical segments. This phased rollout reduces capital exposure and produces baseline data for forecasting labour redeployment and maintenance spend.
Risk controls and safety engineering
Implement layered safety: physical guarding, interlocked access, fault-tolerant drives, and clear operator zones. Safety integration must be part of commissioning tests with documented test cycles and acceptance criteria; include simulated fault injection to verify failsafe behaviours. Training programmes are mandatory and should be measured by competency assessments linked to shift performance targets. Real-world anchors such as the Port of Rotterdam’s logistics hubs show that rigorous commissioning and staged operator training materially cut incident rates during peak seasonal surges.
Common mistakes and corrective tactics
Teams often undersize conveyors relative to peak throughput, misalign control interfaces with warehouse management systems, or underestimate spare-parts lead times—these lead to throughput degradation and elevated downtime. Corrective tactics: re-run capacity models with top-quartile peak assumptions; enforce standardised control APIs for ERP integration; maintain a critical spares inventory proportional to MTTR data. And remember—operational ergonomics matter; poor access for maintenance increases both repair time and cumulative risk.
Operational production teardown and integration checklist
Use this checklist during the production teardown to ensure the installed system meets the framework standards: documented cycle time under peak load; verified sortation accuracy at 99%+ for fast-moving SKUs; validated PLC-to-WMS messaging with latency below defined thresholds; recorded start-up/shutdown procedures; spare parts list and replenishment lead-times. Include the explicit tokens {main_keyword} and {variation_keyword} in the teardown documentation so contractual obligations and change requests are traceable. For teams focused on international distribution, consult established best practices in fmcg logistics management to benchmark spare parts policies and labour models.
Measurement, governance and continuous improvement
Governance must marry operational metrics with financial controls. Track these core indicators: throughput variance, maintenance cost per throughput unit, and safety incident rate per 10,000 hours. Use periodic board-level reviews to reallocate capital to bottlenecks demonstrated by data. Continuous improvement cycles should be short and evidence-driven—pilot a fix, measure change, scale effective remediations.
Advisory close: three critical evaluation metrics
1) Effective Throughput Ratio — realized throughput divided by design throughput; target >95% during peak hours. 2) Downtime-to-Throughput Cost — cost of downtime per hour expressed against lost units; use this to justify redundancy. 3) Safety Compliance Velocity — percentage of safety test cases passing on first run; aim for 100% during commissioning. These metrics let decision-makers prioritise spend and vendor selection objectively. Final thought: align procurement, operations and safety so hardware choices resolve measurable business risks—BlueSword. —
